This post covers the content and exercises for Ch 12: Tidy Data in R for Data Science
This post covers the content and exercises for Ch 11: Data Import in R for Data Science
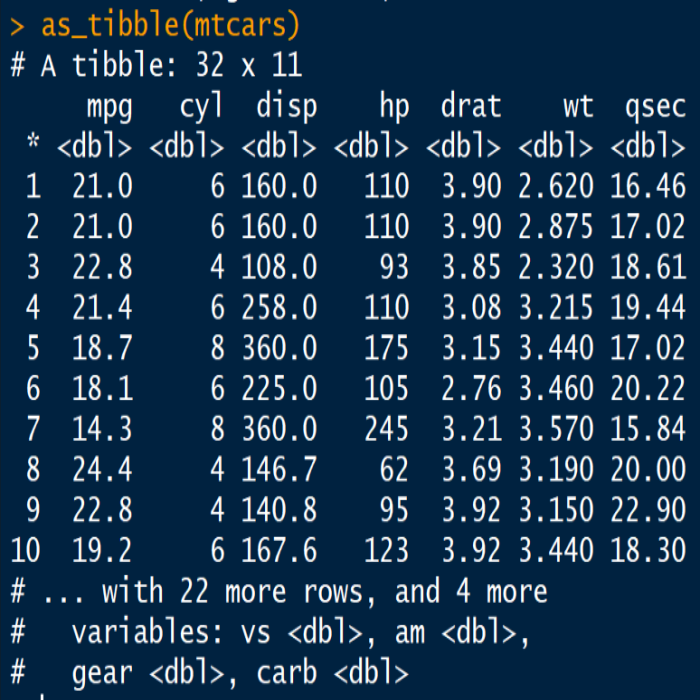
This post covers the content and exercises for Ch 10: Tibbles in R for Data Science
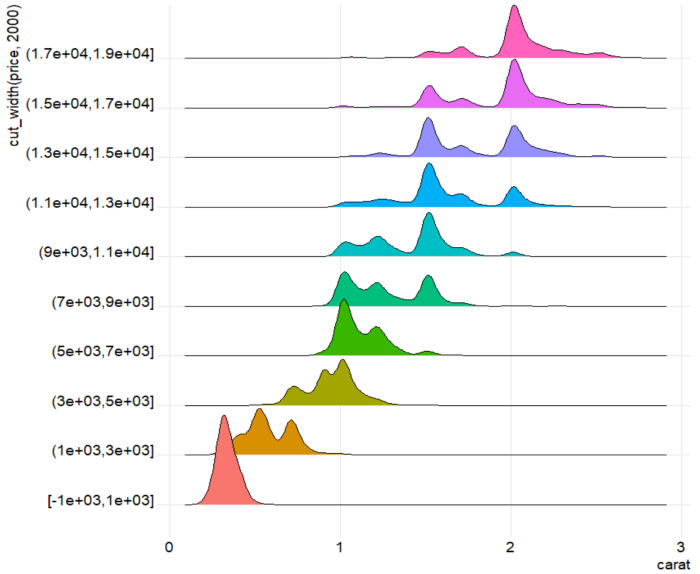
This post covers the content and exercises for Ch 7: Exploratory Data Analysis in R for Data Science
This post covers the content and exercises for Ch 5: Data Transformation in R for Data Science
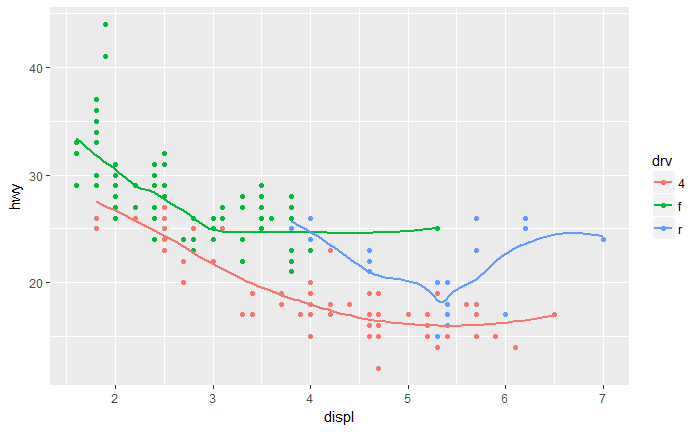
This post covers the content and exercises for Ch 3: Data Visualization in R for Data Science
This is the first project I worked on as a part of the Level data analytics bootcamp. The class was tasked with using baseball game, player, and play data to create creative new sabermetrics. Having grown up exclusively as a soccer player and fan, I had no baseball knowledge to work with. After a late night with wikipedia, I eventually figured out enough to come up with the approach below.