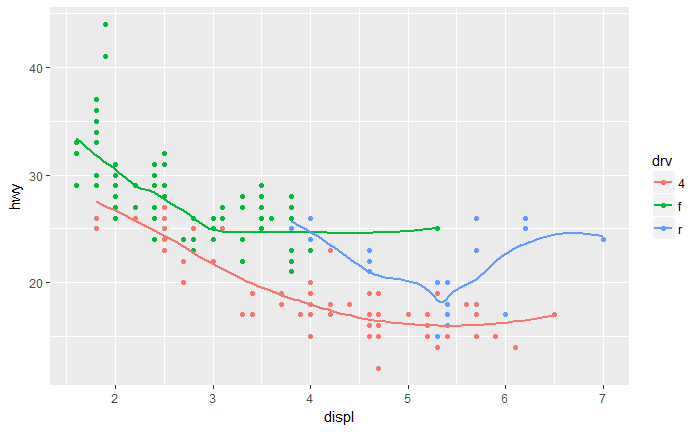
This post covers the content and exercises for Ch 3: Data Visualization in R for Data Science
This is the first project I worked on as a part of the Level data analytics bootcamp. The class was tasked with using baseball game, player, and play data to create creative new sabermetrics. Having grown up exclusively as a soccer player and fan, I had no baseball knowledge to work with. After a late night with wikipedia, I eventually figured out enough to come up with the approach below.
This is the second course project I worked on as a part of the Level data analytics bootcamp. It is an analysis of the skills gap in New York City, with an emphasis on gaining familiarity with using SQL to query databases and Tableau for visualization.
Problem Statement I was asked to identify industries and specific occupations where skills gaps exist in NYC, and then provide recommendations for how to address them going forward.