
Finding NYC Skills Gap
This is the second course project I worked on as a part of the Level data analytics bootcamp. It is an analysis of the skills gap in New York City, with an emphasis on gaining familiarity with using SQL to query databases and Tableau for visualization.
Problem Statement
I was asked to identify industries and specific occupations where skills gaps exist in NYC, and then provide recommendations for how to address them going forward.
Data
The data is provided by Burning Glass and pulled into a MySQL database, and is imported into R for analysis and Tableau for additional visualizations.
Data Model
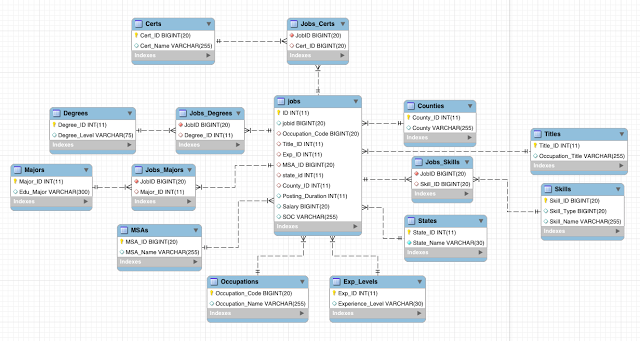
The data consists of all current open job postings, and has numerous attributes associated with each posting like the duration it’s been open, requirements, and job details.
Data Exploration
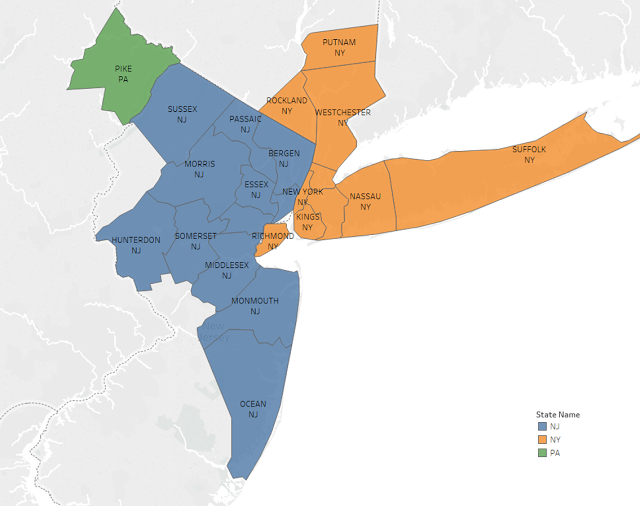
The New York metropolitan statistical area will be considered for analysis, which spans 3 different states: New York, New Jersey, and Pennsylvania.
New York Metro Area
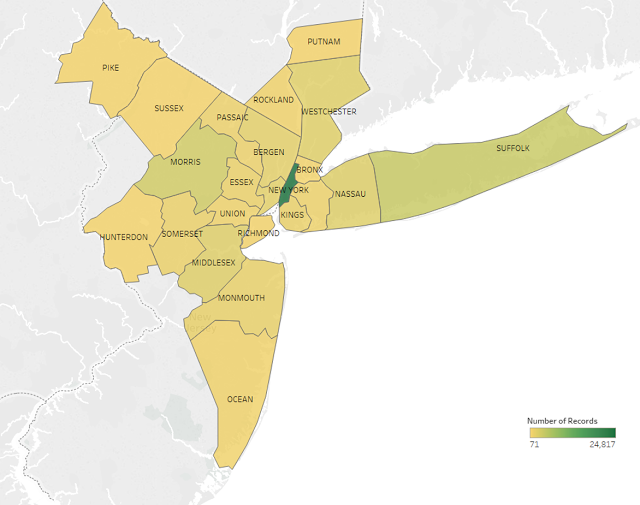
The majority of job openings are in Manhattan, which matches up with intuition since the population there is so much higher than the surrounding areas.
Manhattan has the Jobs
Define Skills Gap Criteria
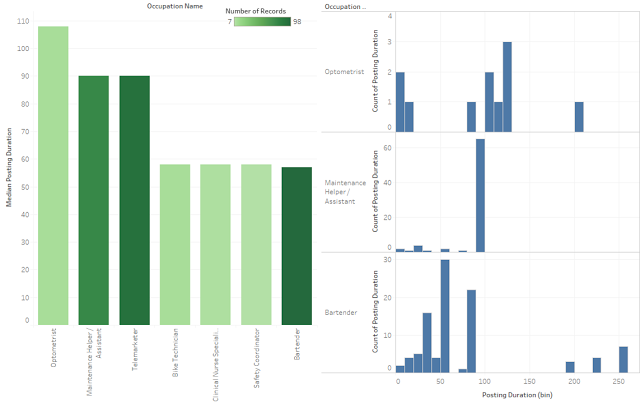
My first thought was to look at posting duration alone as an indicator of skills gap. However as seen in the plot below, this is not a good metric since occupations with low number of posts can have extremely high average values. For example Optometrists have a huge average posting duration, but there are only 11 postings. While it may be difficult to fill Optometrist positions, this is not particularly useful for making general city-wide recommendations.
Posting Duration Alone Isn’t Enough
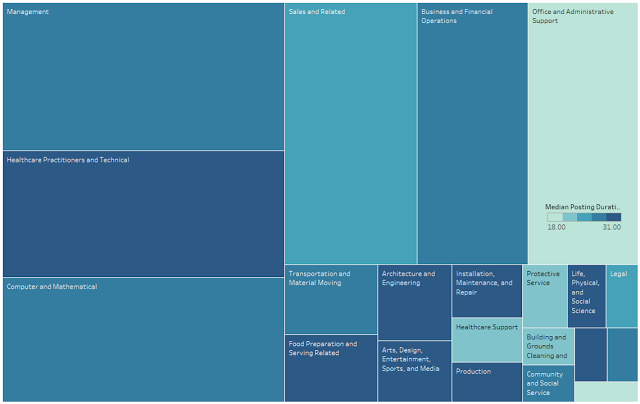
After considering several alternative methods, I landed on a plan to look at industries (as defined by occupation codes) with median posting duration > 15 days, and number of openings > 1000. This approach left me with the top industries:
- Management
- Healthcare
- Computer and Math
- Sales
- Business and Finance
- Office and Admin
Top Industries
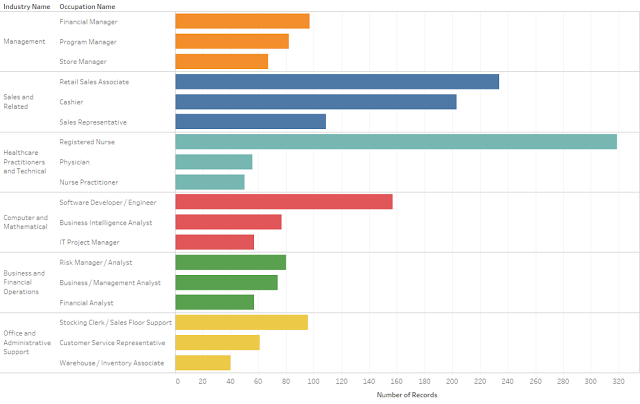
Drilling down within those industries, the top occupations as defined by number of records with high posting duration are shown in the chart below.
Top Occupations
Qualities of Top Occupations
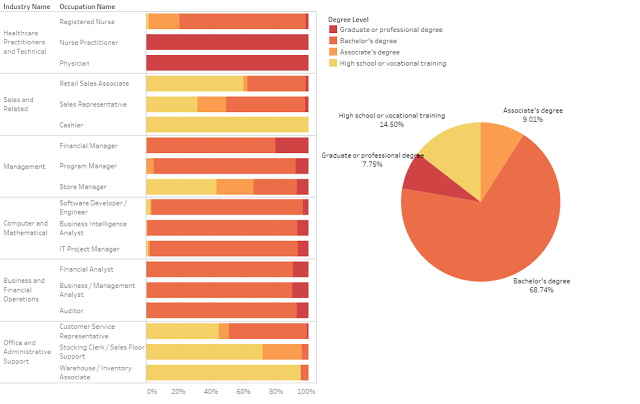
Now that in-demand industries and occupations have been identified, I’m able to look at what kind of requirements they share with each other. The first attribute I’m interested in is the degree requirements. As seen in the below chart, a Bachelor’s degree is required for 68.74% of the openings with a significant drop off to the next most common requirement of high school / vocational training at 14.50%.
Employers want Bachelor’s degrees
I look at required skills next, and visualize the most common in a word cloud. Soft skills like communication, customer service, and organization are the most commonly desired attributes. This result makes sense because essentially every job will require these skills, while more specific job related skills get washed out when they are aggregated together.
Soft Skills are Universal

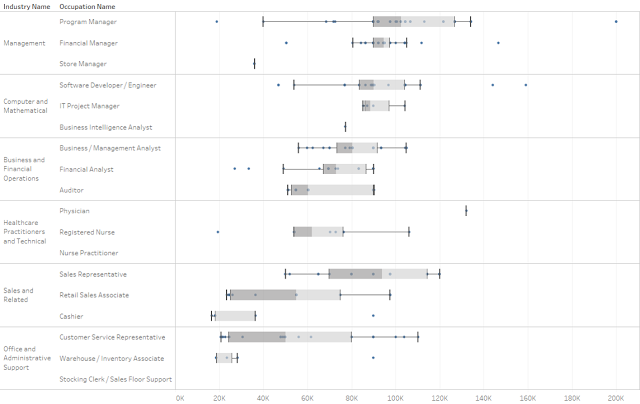
Unfortunately the salary data is very sparse in the data set, so filtering for it reduces the observations significantly. However there is enough remaining to see some expected patterns like management and computer jobs having higher average salaries than retail and administrative positions. Healthcare salaries would probably be higher, except that there are almost no data points for physicians or nurse practitioners.
Salaries are Variable, But Retail & Admin Roles are Unlikely to Make You Rich
Recommendations
The most notable insight I came away from this analysis with is to address the Bachelor’s degree requirement that the majority of the top occupations have. Funding should be directed to make college more accessible with programs like Pathways to Prosperity and the Early College Model.
Code used for this analysis can be found here: GitHub Repo
